Lately, I’ve been working on visualization some security data we have at work. While I can’t share exactly what I’m doing, I thought I’d share a little of what I’m doing.
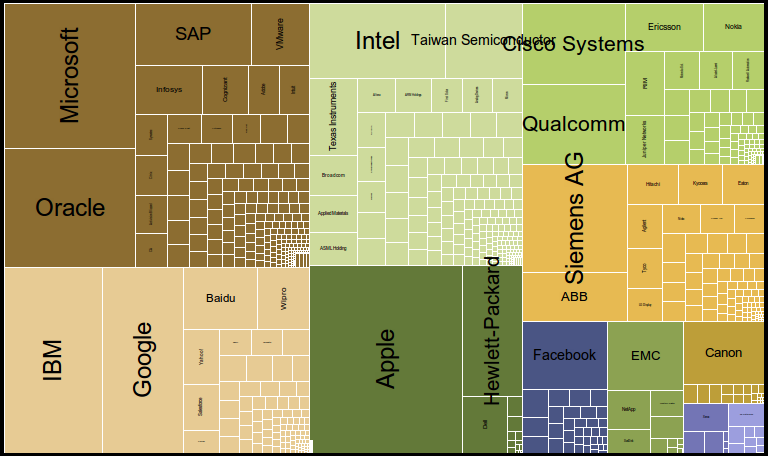
I created a treemap of technology company market capitalization data as of today using Protovis. The different colors correspond to different sub-sectors. The startup data is hazy as there’s no publicly available market and I did the best I could. My goal was to compare the size of these technology companies and see if I could see anything interesting. One interesting note is that Facebook is about as big as the combined rest of the startups. Google and IBM rule the services world. Apple rules the hardware world, but I’m not sure I’d classify them as a hardware company.
Regardless, enjoy!
Be interested to see a 2013 version … especially with some of today’s major players in the cell phone industry – maybe you could rechristen Apple as a “mobile hardware” company?!